Cloud and SaaS Contract Tracker
Overview
The Cloud and SaaS Contract Tracker in nOps provides a comprehensive view of cloud commitment utilization, helping users track their cost efficiency accurately. This feature supports tracking commitments from all of our integrations such as AWS, Databricks, Snowflake, and more, providing critical insights into contract commitments. It offers real-time tracking, in-depth data visualization, and detailed utilization insights, allowing users to optimize their cloud spend effectively.
Key Features
- Commitment Tracking: Monitor AWS, Databricks, and SaaS commitments, including PPAs and EDP’s, and usage based contracts.
- Commitment Summary: Quickly view total commitment and spend details for each contract.
- Interactive Charts: Intuitive charts and graphs for better data visualization, including historical trends and current burn rates.
- Cost & Usage Summary: View key financial metrics, including total commitment, utilized amount, and remaining balance.
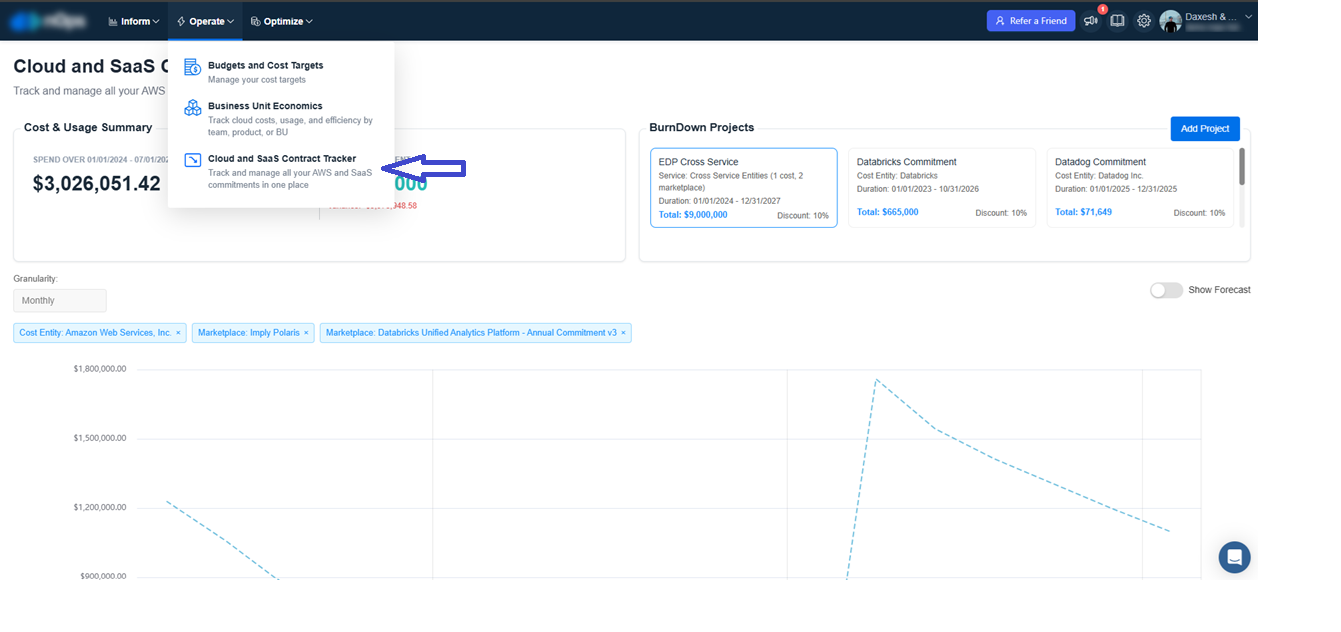
Accessing the Cloud and SaaS Contract Tracker Page
- Log in to your nOps account.
- Navigate to Operate from the main menu.
- Click on Cloud and SaaS Contract Tracker to access the page.
Creating a Burndown Project
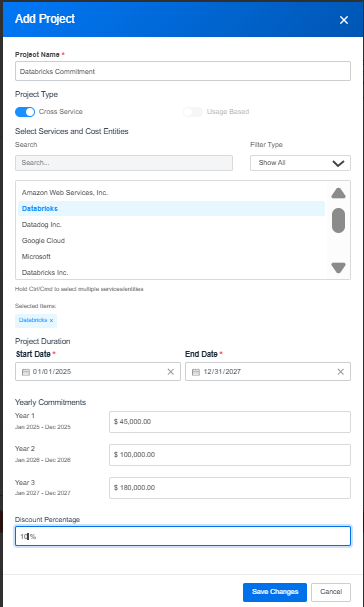
Step 1: Adding a New Burndown Project
- Click the Add Project button on the Burndown Tracker page.
- Provide the following details in the popup:
- Project Name: Give a meaningful name to your Burndown Project (e.g., Databricks Commitment).
- Project Type: Choose the project type. You can select either Cross Service or Usage Based (both cannot be selected together).
- Cross Service: Allows filtering by cost entities, AWS services, marketplaces, or all combined. This is required for Cross-Service PPA’s.
- Usage Based: Requires selecting a Tracking Method and a Cost Unit based on the chosen method.
- Project Start and End Date: Select the duration for this commitment.
- Yearly Commitments: Enter the yearly commitment amounts as needed.
- Click Save to create your Burndown Project.
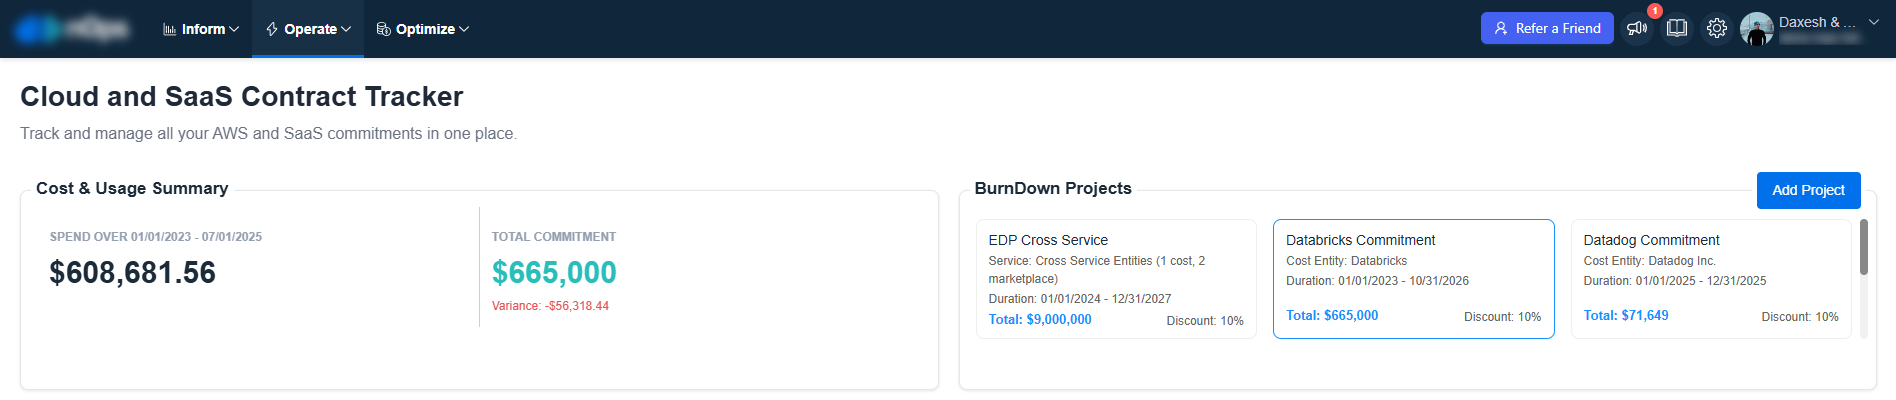
Step 2: Viewing and Managing BurnDown Projects
- Once created, your BurnDown Project will appear as a card in the main list on the BurnDown Tracker page.
- You can Edit or Delete the project by clicking the corresponding icons on the project card.
- Click on a project card to view its detailed dashboard, including Cost & Usage Summary on the left side, showing total commitment, spend over time, and remaining balance.
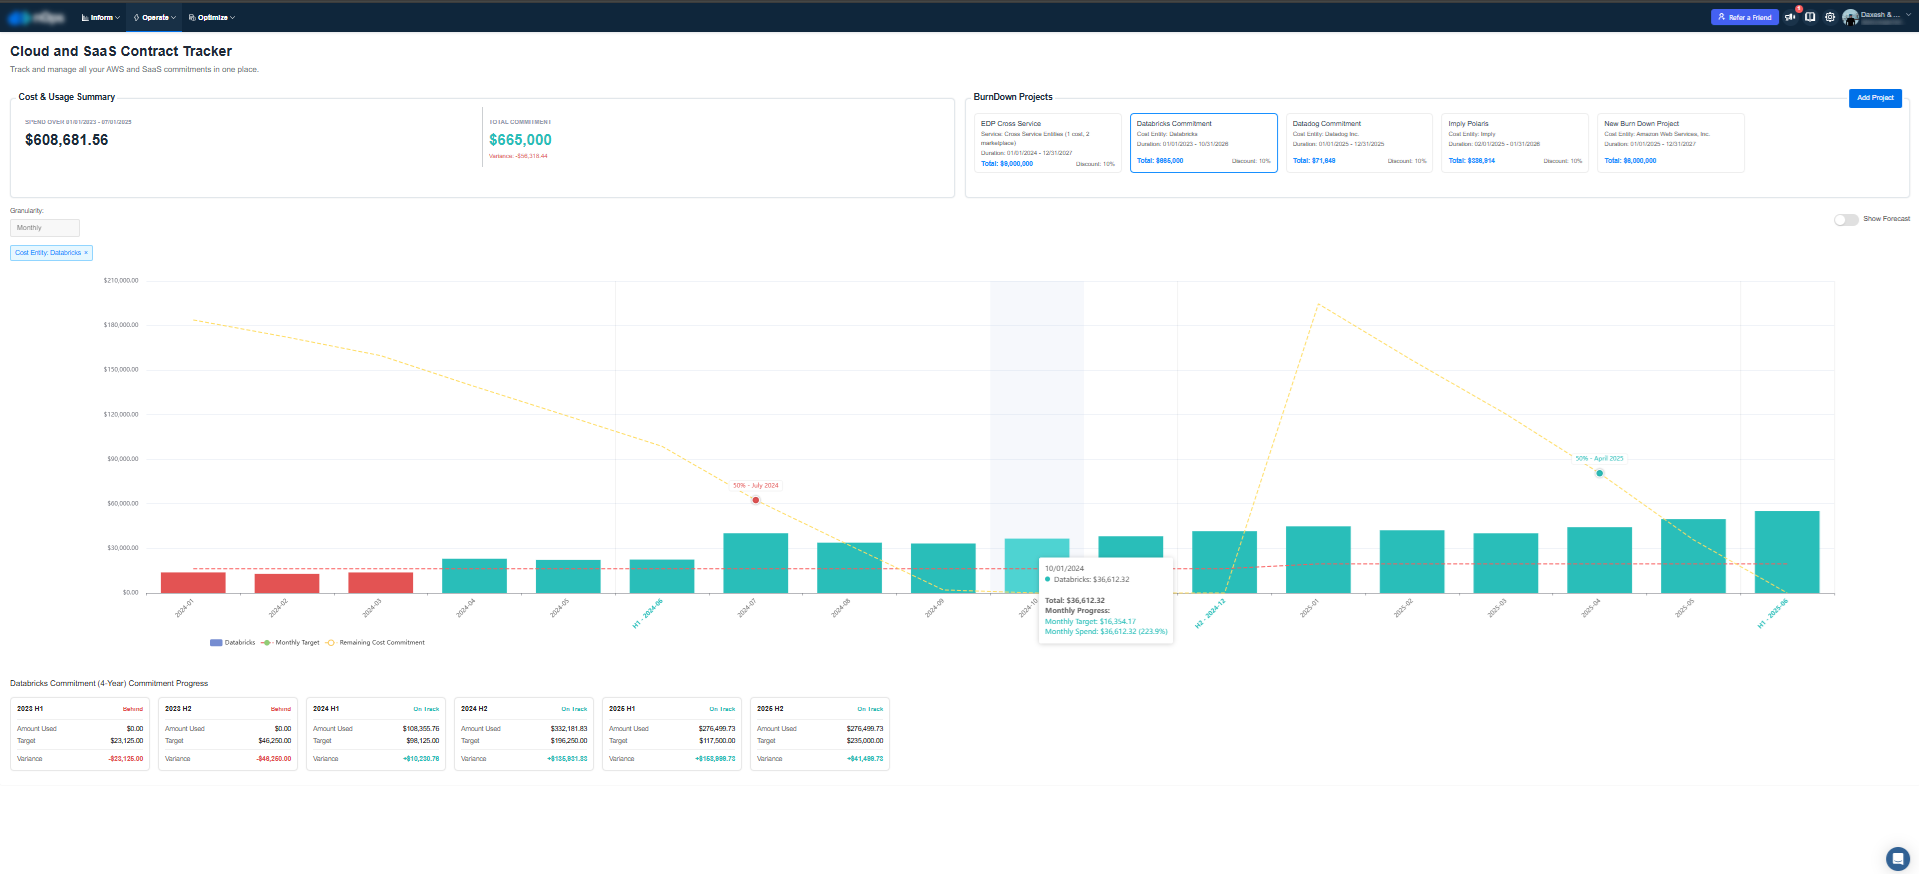
Step 3: Project Selection and Detailed Analysis
- Upon selecting a project, the main section will display a detailed chart visualizing the commitment progress over the selected period. This includes:
- Spend Over Time: A graphical representation of cumulative spend against the total commitment amount.
- Commitment Progress: Half-yearly breakdown, providing a clear view of spend trends and remaining balance.
- Project Selection: Selecting a project updates the main chart to reflect the commitment progress and cost data for the chosen project.
- Review the commitment data displayed in the main section, including start and end dates, commitment amounts, actual usage, and remaining balance.
- Hover over the charts to get precise data points for specific dates.
- Use the Cost & Usage Summary section for a quick overview of key metrics, including total commitment, utilized amount, and remaining balance.