Stay on Top of Cost Changes
Choosing Cloud Resources Cost from the Cost Control pull-down gives you a set of tabs that show your cloud spend broken out by:
-
Cloud Accounts - spend by account in AWS, Azure, etc.
-
Cloud Services - spend by service in each cloud vendor
-
Regions - spend by region in cloud vendor
-
Operations - spend by AWS operation
-
Usage Types - spend by AWS usage type
-
Resources - spend from cloud resources being used
-
Non-resources - spend not specifically from cloud resources
-
Tags - spend by tagged resource, with tagged resources grouped under key name
-
Item Types - spend by AWS cost type
The first seven of these tabs (Cloud Accounts, Cloud Services, Regions, Operations, Usage Types, Resources, Non Resources, Tags, and Item Types) each give you:
-
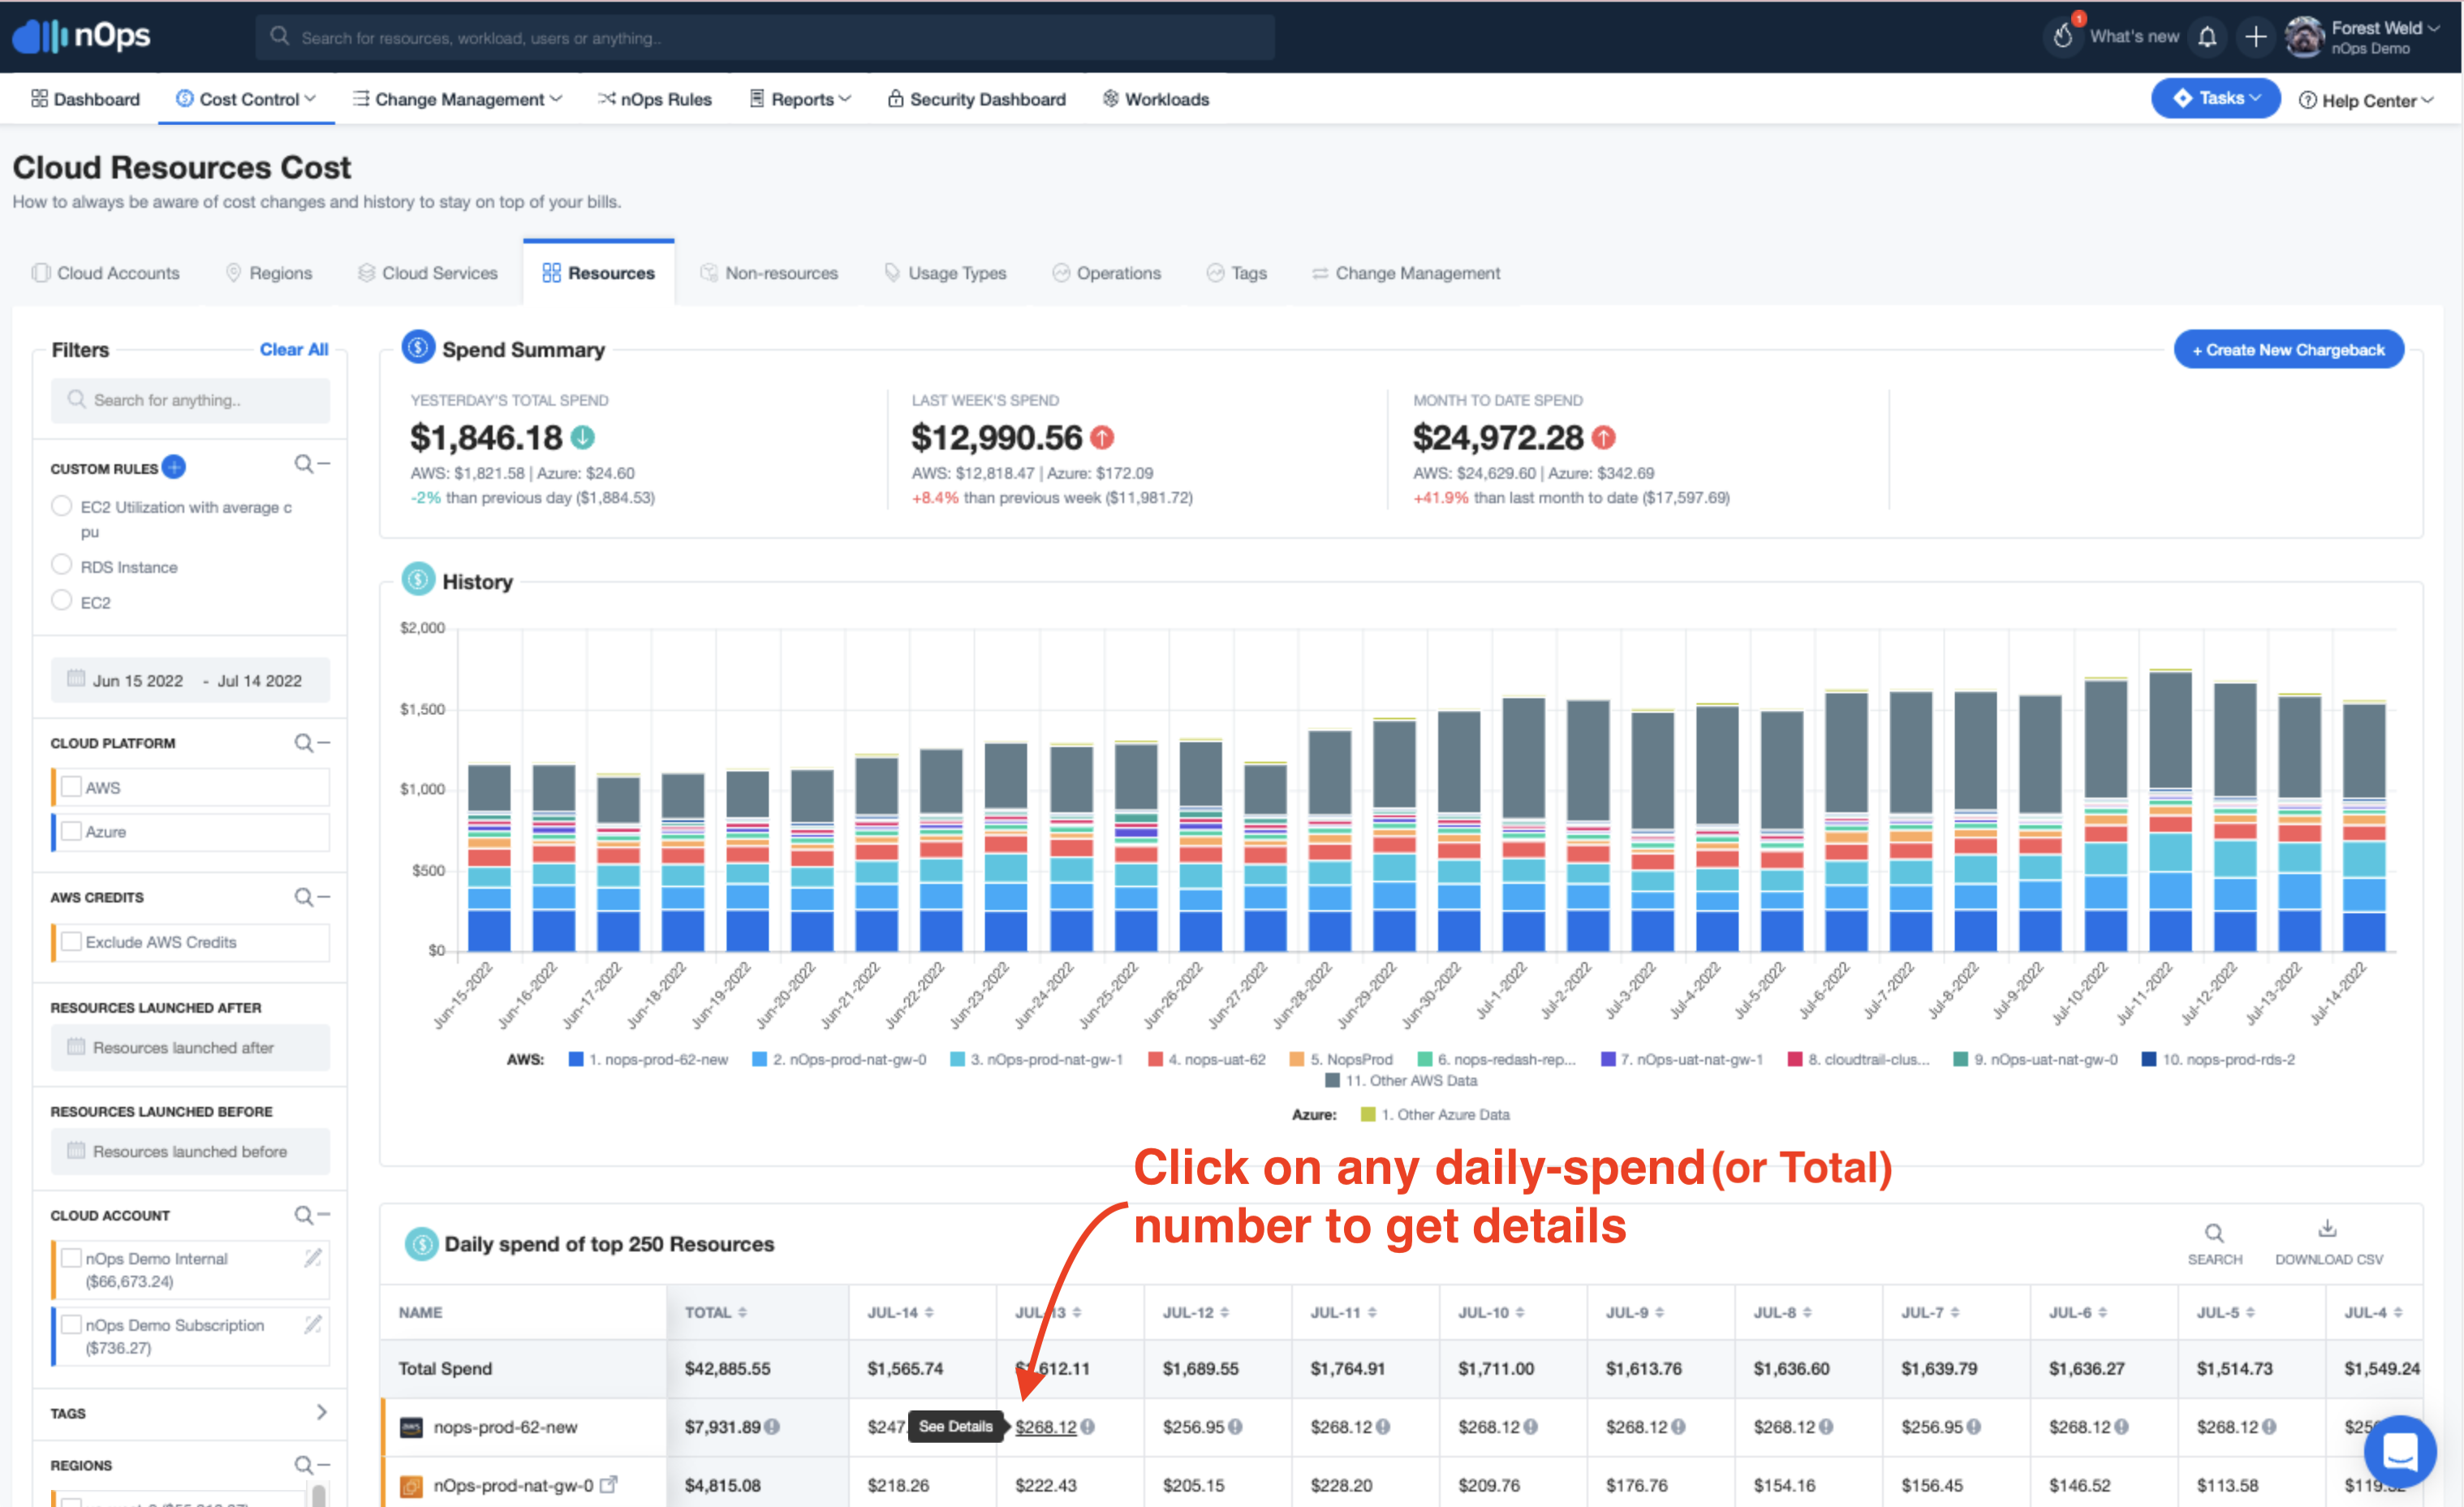
A Spend Summary at the top :
-
Yesterday’s Total Spend
-
Month to Date Spend
-
Total Spend
-
-
An array of Filters in the vertical box at the left, enabling you to view cost trends over time, and to understand which resources contribute to higher costs.
-
A History bar chart just below the Spend Summary. Note the button to the right side of the chart to change the level of granularity
Spend Summaries
A few notes:
-
The periods for the Spend Summary boxes Yesterday, Last Week, and Month to Date are as defined by AWS.
-
If you choose a specific date range in the Filters box at the left, the Spend Summary becomes just the total spend for that date range (no yesterday’s spend, last week’s, or month to date).
-
On the Resources and Non-resources tabs, the Spend Summary gives the appropriate subtotals for resources or non-resources. For the other five tabs, the Spend Summary gives the same overall totals. (The History chart and Daily Spend table below the Spend Summary do give details broken out per the specific tab title.)
-
Credits: The overall credits value in the spend summary is as reported by AWS, and includes both AWS credits and refunds. The number in the Credits box of the Spend Summary is for the specific date range in the Filters box at the left. The credits value in the summary when you hover your cursor over a “circle-_i_” is the portion of the AWS credits plus refunds, reported by AWS, for yesterday, last week, or month to date, depending on the box.
-
Hover text summary: Hovering your cursor over the “circle-_i_” in any of the three Spend Summary boxes gives the Resources, Non-resources, and AWS Credits value for the time period of that box (yesterday, last week, month to date). These numbers and the associated time periods are as defined in AWS.
Filters for Analyzing Costs
The Filters vertical box at the left allows you to zero in on a combination of resources and parameters and so find the sources of cost trends over time, or understand which resources contribute most to higher costs.
Filtering criteria you’ve chosen are shown by ovals above the Spend Summary, so that you can easily track the filtering criteria that you have in effect – however, note that any custom date range is not represented by an oval above the Spend Summary.
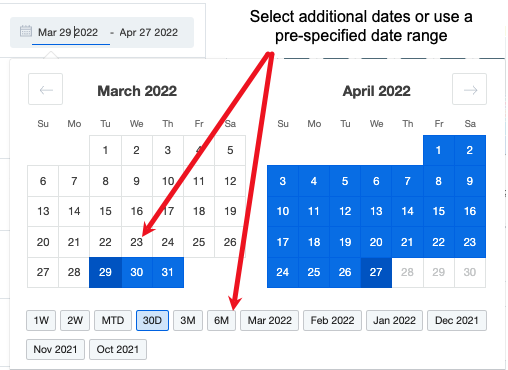
The Filters box includes a calendar tool, which allows you to specify a date range for which costs are to be displayed and summed. When specifying a custom date range:
-
Use the Apply button at the very bottom of the enlarged calendar tool, to make your date range take effect
-
Note the “easy-button” pre-specified date ranges, like 1W, 3M, or May 2022, just above the Apply button.
The default cost display might only cover the preceding month. The calendar tool can be used to view cost changes over time periods that are meaningful to your business.
Spend figures next to regions, cloud-managed services, and other criteria listed in the Filters box are the total for that filter criterion and will match the total in the Daily Spend table on the page.
History Chart
The color-coded choices beneath the chart can be clicked to exclude each from the chart, enabling you to focus on particular regions, services, resources, etc.
Daily Spend
-
The Total column in the table is the total for the date range set in the Filters box on the left.
-
The table of daily values scrolls left to right through the days (scroll bar at bottom) and is paginated 10 records per page (page selection at lower right).
-
The Daily Spend detail on each page has a Download CSV button at the upper right that downloads all spend records for that page. For example, if a tab such as Operations has 170 records, the default view may display only 10 records at a time. However, clicking the download icon will download all records (in this example, 170) in a .csv file:
Non-resources
This tab gives costs not associated directly with a resource, such as taxes and AWS or Azure services (for example, AWS Key Management Service, or AWS CloudTrail). To see a complete list of your non-resource costs for the selected filter criteria (including selected date range in the Filters box calendar tool), click Download CSV at the top of the Daily Spend table below the History bar chart.
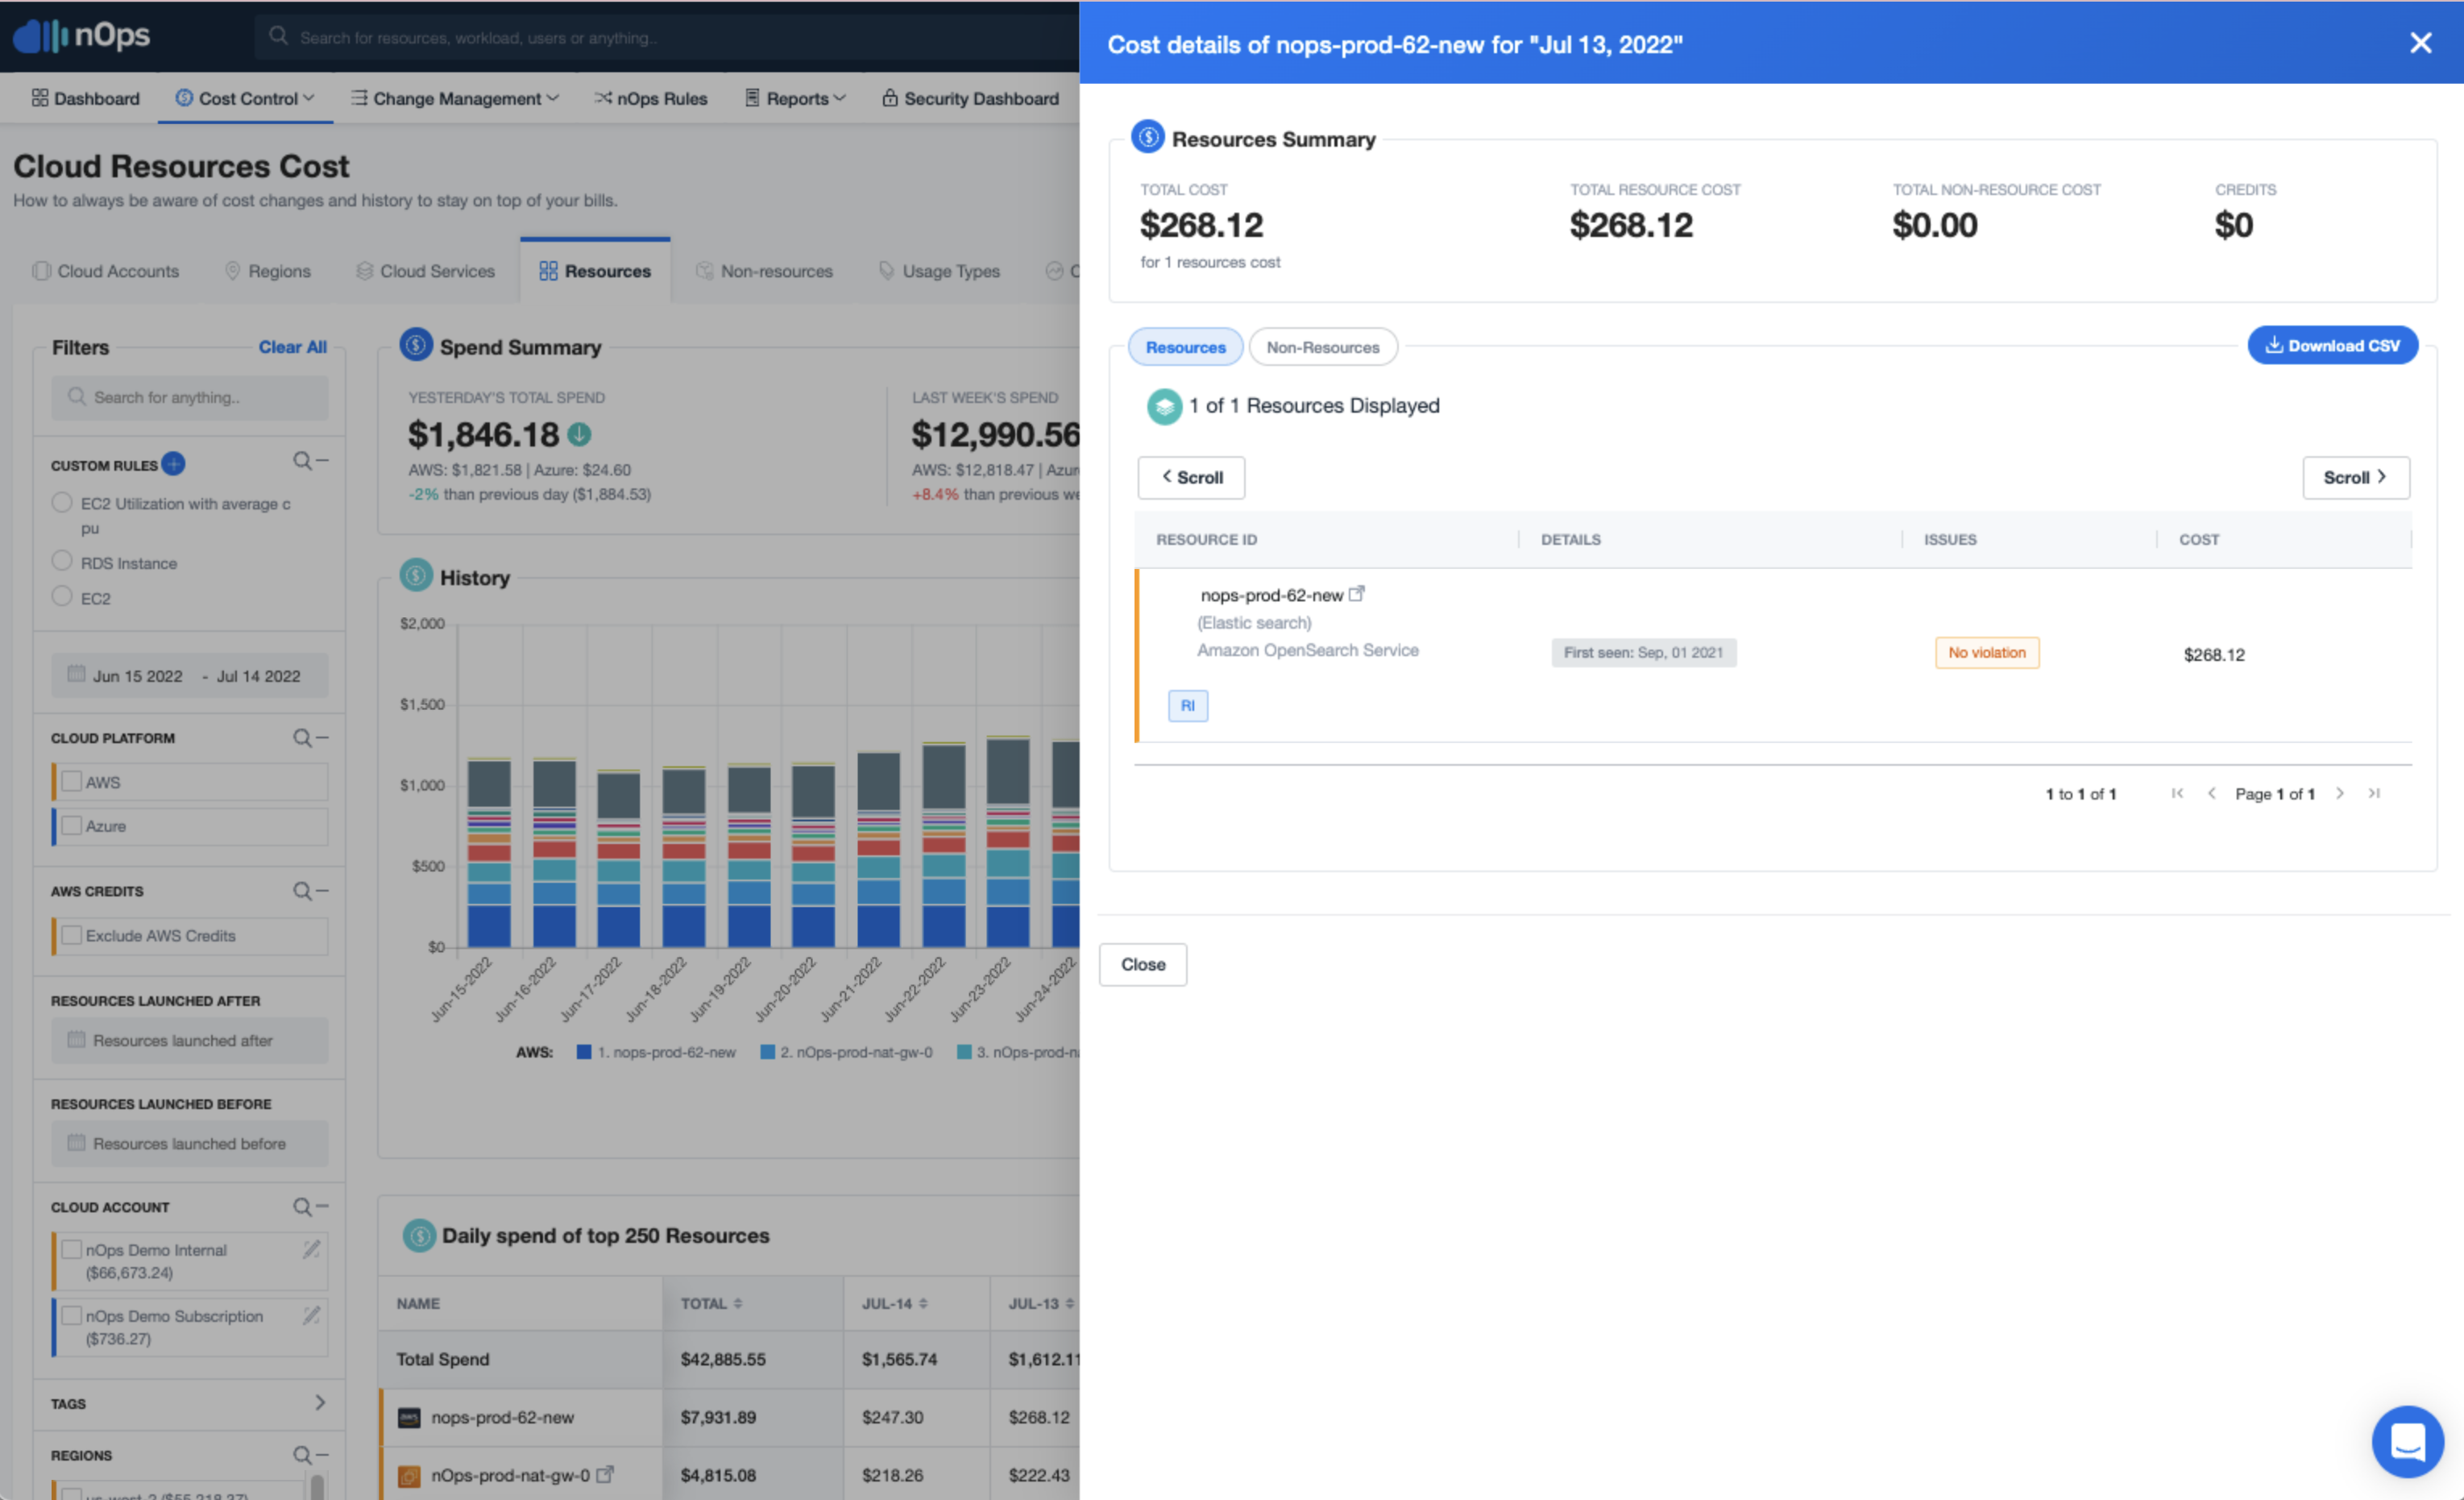
Cost Details for Resources and Non-resources
You can get details for any Daily Spend value or Total value in the Resources or Non-resources pages by clicking on the value:
Tags
The Tags tab gives the spend for all tags by key name. Note that:
-
To see the spend for each value under a key name, expand a key name by clicking on it, or by clicking on > at the right end of the row.
-
To see detailed costs for tag key-value pairs, use the Tag Explorer page under Cost Control (Cost Control pull-down, choose Tag Explorer).
-
A blue Download button (upper right) gives you a CSV file of the spend figures by key name, for all keys. The CSV does not break out by key value.
-
The Cost (total) column gives the total spend for the time period specified in the Filters column at the left – default, 1 month to date.